DOC 03 · S·03 Services / Dashboards and Spreadsheets · useful data
Data readable. Faster decisions.
Reorganised Excel, simple web dashboards, control sheets. Filters that matter and indicators that answer the right questions — no noise, no tabs nobody understands.
Excel with 30 tabs. Nobody can touch it.
A classic pattern: the company grew, the Excel grew, and now only one person understands the structure. Every new question takes 20 minutes hunting for the right cell.
Reorganising the existing file well is usually better than replacing it. When that's not enough, we build a small web dashboard — not to impress anyone, but to answer the question in three seconds.
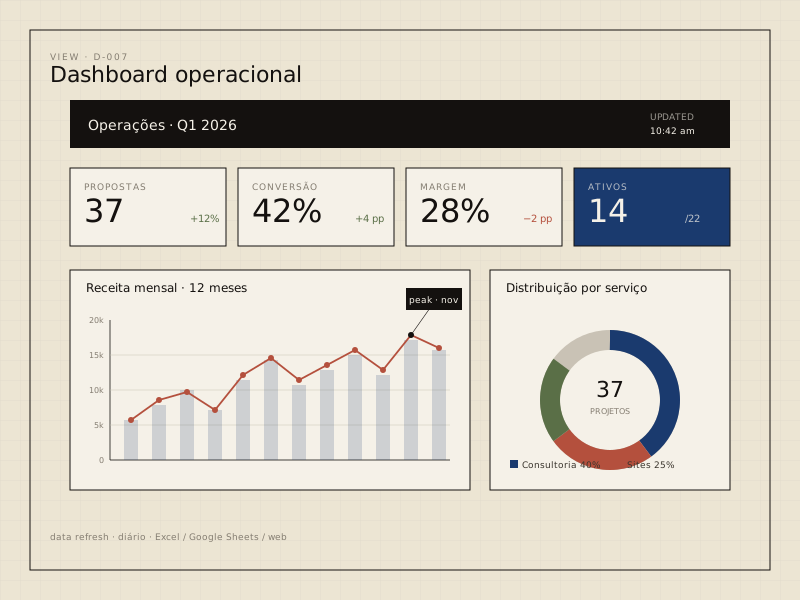
Operational dashboard for a practice — proposals · conversion · margin · active projects. In three seconds.
The manager needed to know, at any moment, how many proposals were open, the conversion rate and the margin by service type. We built a simple dashboard linked to the existing sheets — daily updates, charts that answer the real questions, useful filters.
Stack · HTML + Chart.js + data in Google Sheets. Access · simple login. Maintenance · zero — the data comes from the sheets the team already kept.
What comes out of it.
Every project is different, but these are the typical types of deliverables. They combine according to scope.
- Restructuring of existing spreadsheets
- Dashboards in Excel, Google Sheets or web
- Custom indicators and charts (KPIs)
- Filters and views by department or client
- Validations to reduce data-entry errors
- Reusable templates for future projects
- Managers who need to see the state of the business
- Sales teams with a pipeline in Excel
- Technical teams tracking hours and costs per project
- Companies that rely heavily on Excel
- Anyone tired of producing the same report by hand
Proceed with a request.
Briefly describe the problem. RFAS replies with a practical suggestion and an indication of the simplest scope to start with.